
Nonprofit leaders need clear financial visibility to make confident decisions, but too often, they are working from reports that are detailed, delayed, or difficult to interpret quickly.
A statement of activities can show what happened, and a statement of functional expenses can show how resources are allocated, but a nonprofit financial dashboard helps leadership teams, board members, and program managers understand what the numbers mean and what action to take next.
A well-designed financial dashboard turns complex data into clear, visual insight. It helps nonprofit organizations monitor financial health, identify risks, track sustainability, and keep financial decisions aligned with the mission.
Below are five essential nonprofit financial dashboard metrics every organization should track.
1. Budget-to-Actual Comparisons
One of the most important metrics for any nonprofit financial dashboard is a clear budget-to-actual comparison, a side by-side comparison of how actual financial performance compares to the organization’s approve budget. This helps leaders understand whether revenue and expenses are tracking as expected or whether adjustments are needed.
A strong budget-to-actual dashboard should include:
- Revenue shortfalls
- Overspending
- Unexpected variances
- Trends over time (including by month, quarter, department, or program)
Budget-to-actual reporting gives nonprofit leaders early insight into financial issues, allowing users to easily drill down into transaction-level details when something looks off. This level of visibility enables leadership to identify issues early and make adjustments before small problems become larger financial challenges.
This is especially important for nonprofits operating with tight margins, grant restrictions, or limited reserves. A dashboard should show not only where the organization stands today, but also whether current trends may create financial pressure later.
Related Resource: How Nonprofits Can Build a Grant Compliance Checklist to Stay Audit Ready
2. Cash Position and Cash Flow
A nonprofit can look financially stable on paper and still experience cash flow challenges.
This often happens because of timing. Grants may be awarded but not yet received, reimbursement payments may lag behind expenses, donations may fluctuate throughout the year, and/or program costs may occur before related funding arrives.
Every nonprofit cash flow dashboard should clearly display:
- Current cash balances
- Expected cash inflows
- Upcoming cash outflows
- Projected cash needs
- Months of cash on hand
Cash flow visibility helps organizations avoid operational disruptions and maintain financial stability throughout the year.
This metric is especially valuable for organizations that rely on reimbursement-based grants, government contracts, seasonal fundraising campaigns, or restricted funding. Knowing what cash is available, when more cash is expected, and what obligations are coming due helps leadership plan instead of react.
A strong dashboard should make cash flow easy to understand at a glance. Board members and executives should be able to see whether the organization has enough liquidity to support operations, payroll, programs, and upcoming commitments.
3. Revenue Sources and Funding Diversity
Most nonprofits rely on several revenue sources, including donations, grants, sponsorships, program revenue, events, and government funding.
A nonprofit financial dashboard should make it easy to see where revenue is coming from and how diversified those funding sources are.
This visibility helps nonprofit leaders:
- Identify overreliance on a single donor, grant, or funding source
- Monitor fundraising performance
- Track grant and program revenue trends
- Evaluate long-term financial sustainability
- Make stronger planning decisions
A healthy mix of revenue sources creates greater financial resilience. If a major grant ends, a large donor reduces giving, or an event underperforms, the organization may face sudden financial pressure.
A dashboard helps leadership see those risks earlier. It also helps finance, development, and executive teams stay aligned around funding strategy.
Bonus Tip
For deeper insight, consider showing revenue by category, department, campaign, donor type, or funding restriction. This gives leaders a more complete view of both current revenue performance and long-term sustainability.
4. Restricted Vs. Unrestricted Funds
Tracking restricted vs. unrestricted funds is one of the most important financial management responsibilities for nonprofit organizations.
Unlike for-profit businesses, nonprofits often receive funds that can only be used for specific programs, purposes, or time periods. Without clear visibility, it can be easy to confuse cash in the bank with cash that is actually available for general operations.
A strong nonprofit financial dashboard should clearly separate:
- Restricted funds
- Unrestricted funds
- Temporarily restricted funds
- Remaining grant balances
- Program-specific funding
This distinction is essential for compliance, planning, and audit readiness.
Tracking restricted and unrestricted funds helps prevent the unintentional misuse of designated funds. It also gives leadership a more accurate picture of financial flexibility.
For example, a nonprofit may have a strong overall cash balance, but if much of that cash is restricted, the organization may still have limited resources available for payroll, administrative needs, or strategic investments.
A dashboard that clearly separates restricted and unrestricted funding helps board members and leadership teams understand the difference between total resources and usable resources.
Related Resource: Managing Temporarily Restricted Funds
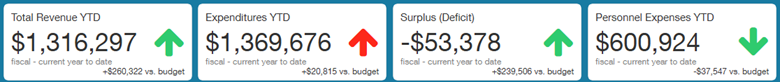
5. Key Financial Health Indicators for Nonprofits
No dashboard would be complete without nonprofit financial metrics or key performance indicators (KPIs). These high-level metrics help leadership and board members quickly assess organizational health without digging through detailed reports.
Common examples of nonprofit financial KPIs include:
- Operating reserve ratio
- Program efficiency ratio
- Fundraising efficiency
- Revenue diversity
- Months of cash on hand
These nonprofit financial metrics help answer important leadership and governance questions:
- Are we financially stable?
- Do we have enough reserves?
- Are we too dependent on one funding source?
- Are we using resources effectively?
- Are we positioned to support the mission long term?
The right KPIs will vary by organization. A small community nonprofit may need different dashboard metrics than a large organization with multiple programs, grants, and departments.
Overall, these metrics provide leadership with a quick snapshot of both the organization’s financial health and its long-term sustainability.
What to Include in a Nonprofit Financial Dashboard
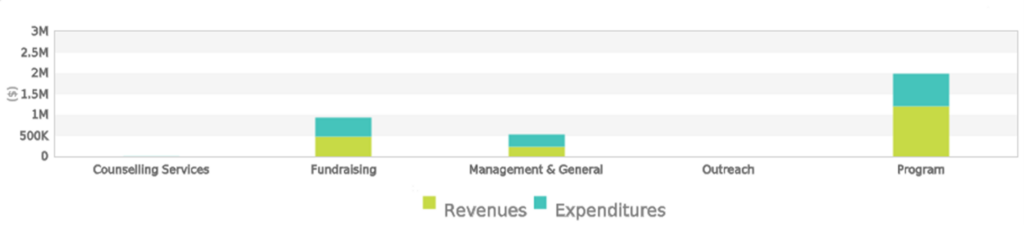
A useful nonprofit financial dashboard may include visuals such as:
- Revenue and expenses by department
- Budget-to-actual performance
- Cash balance trends
- Cash flow projections
- Grant balances
- Restricted and unrestricted fund summaries
- Revenue by source
- Program-level financial performance
- Key financial ratios
- Operating reserve trends
These visuals make financial information easier to understand and act on. They also help leadership teams and board members focus on the metrics that matter most.
An effective dashboard should be simple enough for non-finance users to understand, but detailed enough to support meaningful decisions.
How to Choose the Right Nonprofit Dashboard Metrics
The best nonprofit financial dashboard is the one that answers the most important questions.
Before building or improving your dashboard, ask:
- What financial information does leadership need every month?
- What does the board need to monitor for governance?
- Which programs need better financial visibility?
- Where are the biggest financial risks?
- Which metrics connect most directly to our mission and sustainability?
Dashboards are most useful when they are designed around decisions, not just reports.
For example, if cash flow is the biggest risk, the dashboard should make cash projections highly visible. If grant compliance is a major concern, restricted fund balances and grant spending should be easy to review. If board members struggle to interpret financial statements, high-level KPIs and simple visuals may be the priority.
Final Thoughts
When everyone has access to clear, meaningful financial insights, it becomes easier to align your strategic decisions with your mission, use resources effectively, and move forward with confidence.
For many nonprofits, building the right dashboard starts with asking the right questions: What do we need to know to make better decisions? What financial metrics matter most to our mission?
When those answers are reflected in your dashboard, you move from simply reporting numbers to truly understanding and using them.
Related Resource: Outsourced Accounting vs Fractional CFO Services for Nonprofits
Frequently Asked Questions: Nonprofit Financial Dashboards
What is a nonprofit financial dashboard?
A nonprofit financial dashboard is a visual reporting tool that shows important financial metrics in one place. It helps leaders, board members, and finance teams monitor financial performance, cash flow, funding sources, and organizational sustainability.
What should be included in a nonprofit financial dashboard?
A nonprofit financial dashboard should include budget-to-actual reporting, cash position, cash flow projections, revenue sources, restricted and unrestricted funds, and key financial health indicators.
Why are nonprofit dashboards important?
Nonprofit dashboards are important because they make financial information easier to understand and use. They help organizations identify risks, monitor performance, support board reporting, and make more informed decisions.
How often should a nonprofit financial dashboard be updated?
Most nonprofit financial dashboards should be updated monthly. Organizations with tight cash flow, large grants, or reimbursement-based funding may benefit from more frequent updates.
What are the most important nonprofit financial KPIs?
Common nonprofit financial KPIs include operating reserve ratio, months of cash on hand, program efficiency ratio, fundraising efficiency, revenue diversity, and net asset trends.